App engagement
In this new series, I’m exploring psychology and tech by highlighting exciting recent research.
Last time…
We saw that according to three large (and partially overlapping) meta-analyses, mental health app use resulted in small but statistically significant reductions in depression and anxiety symptoms. However, two of these meta-analyses had some curious engagement-related findings. For example, Valentine and colleagues (2025) noted that users who completed more of their apps’ mental health programs did not experience any additional symptom reduction in comparison to users who completed less of the program. Surprising!
So what’s going on with engagement? And how do we define it?
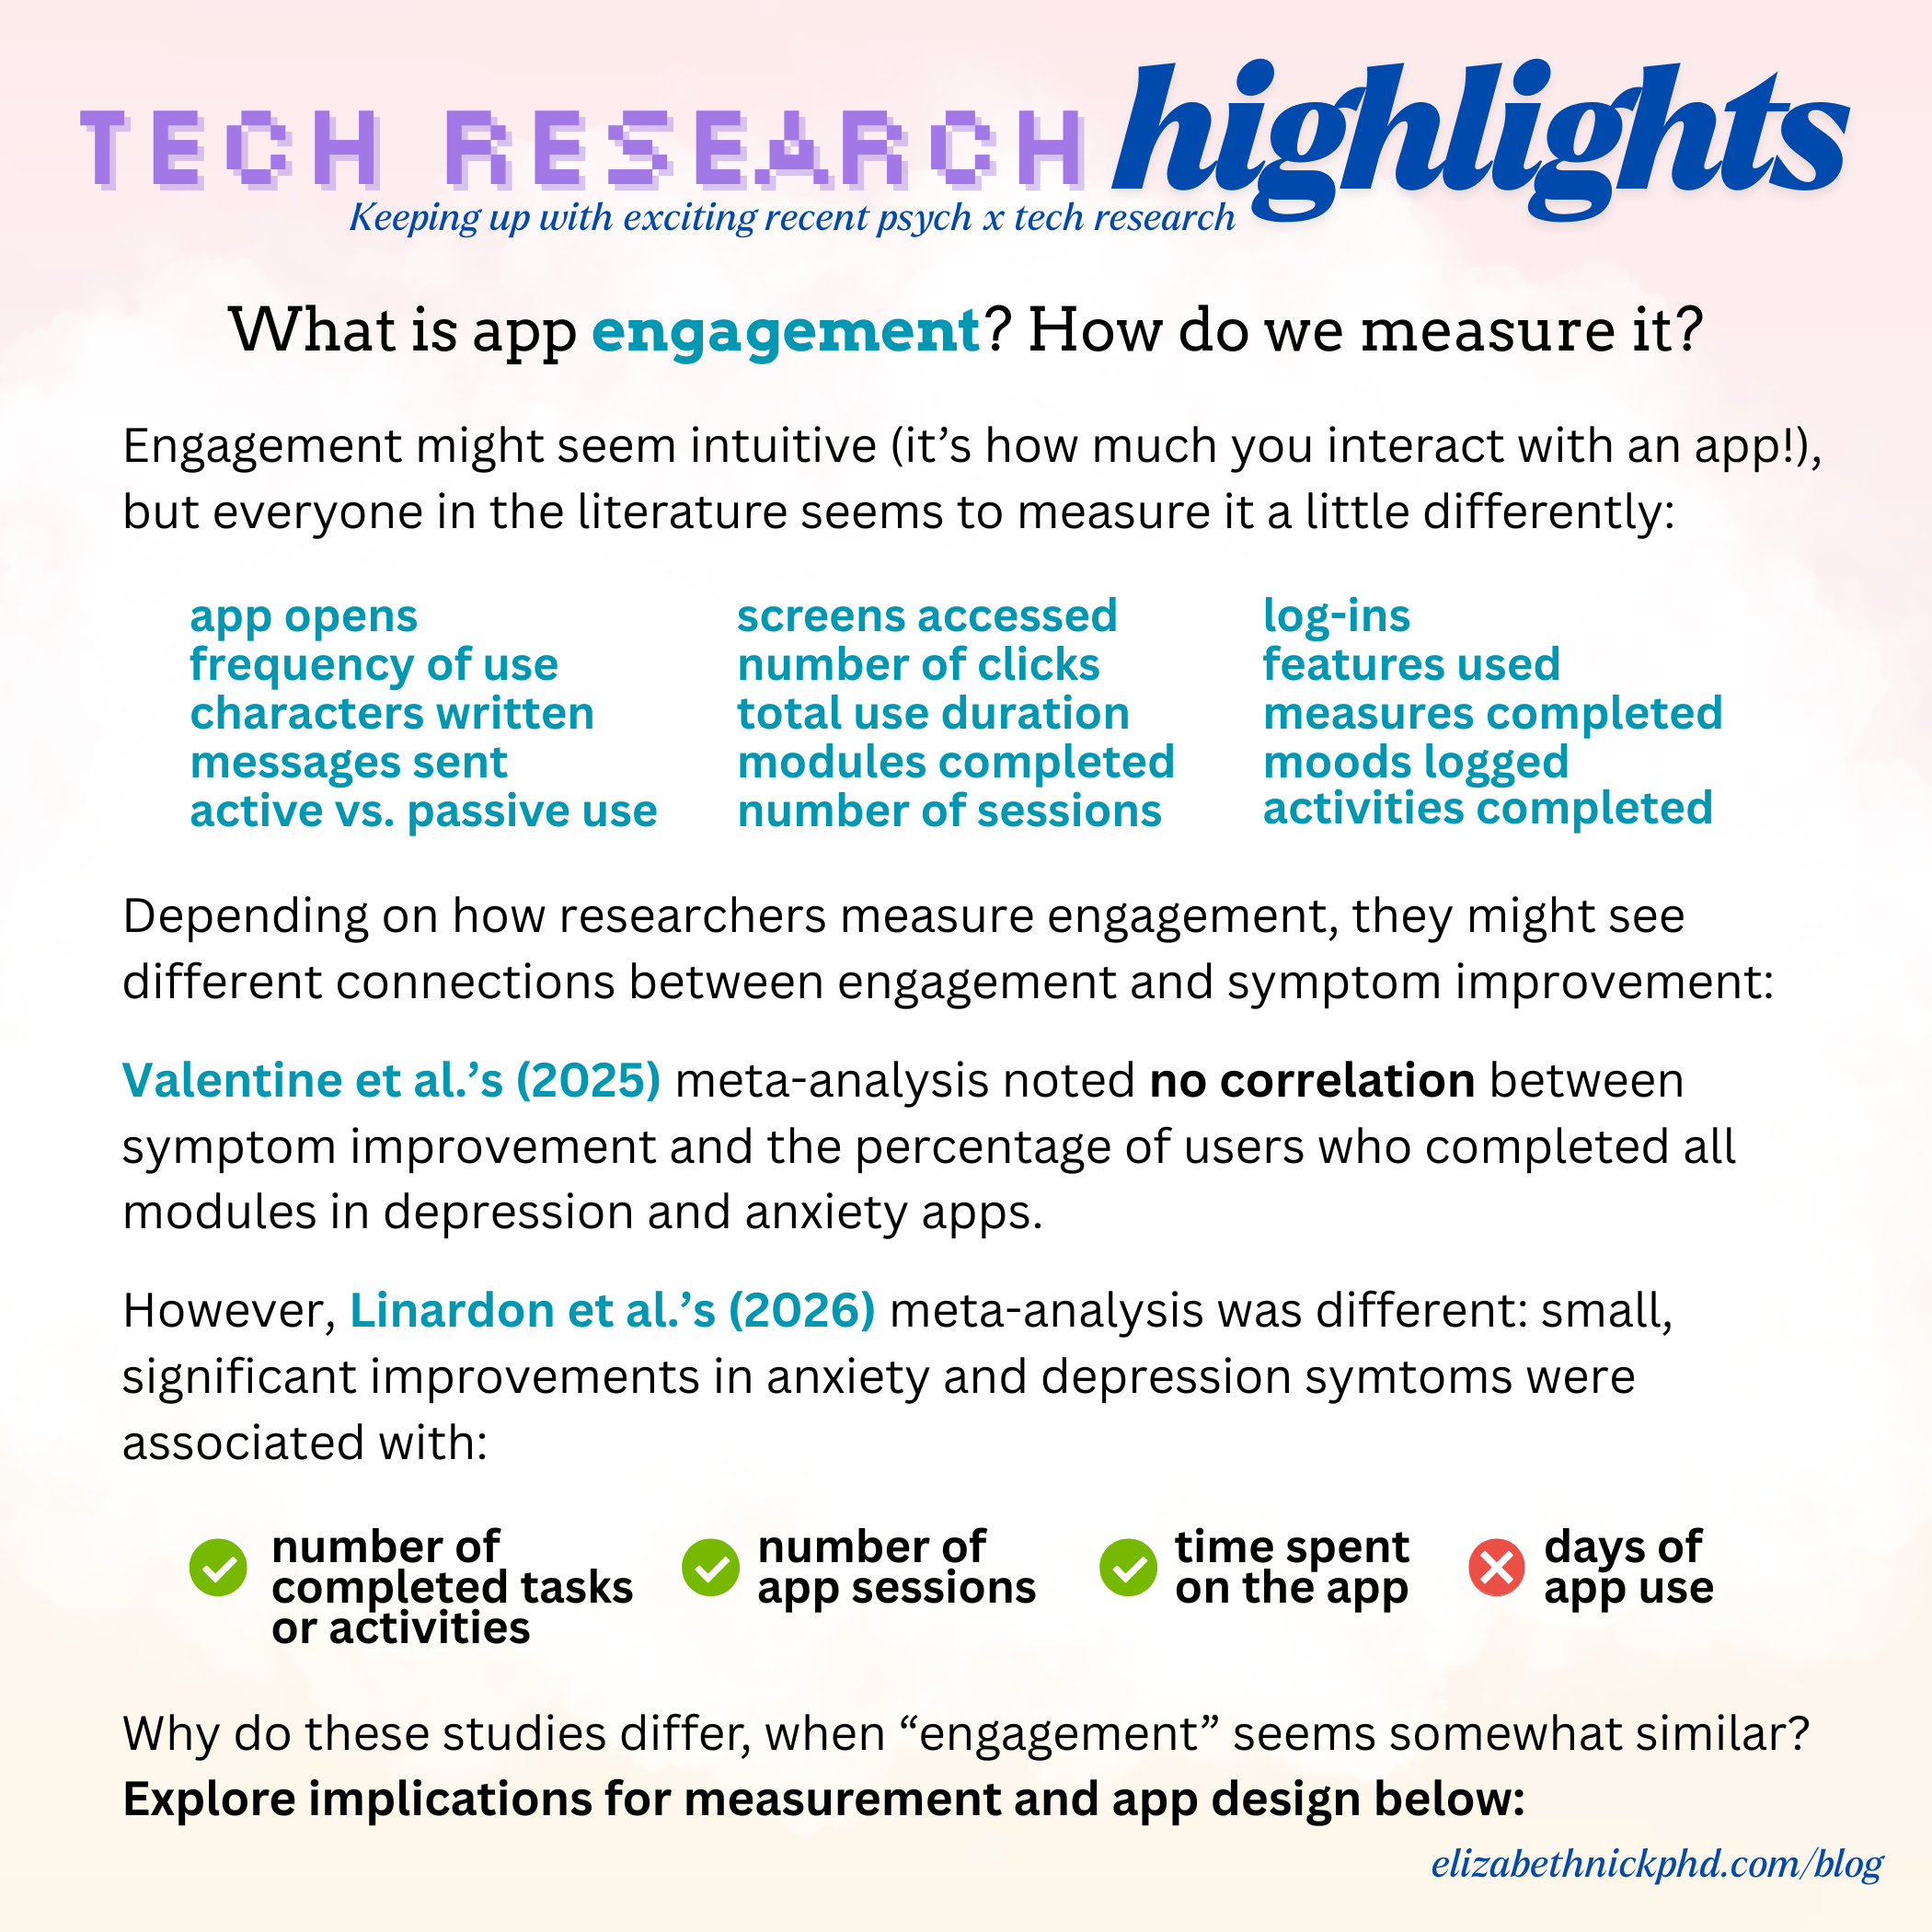
What is app “engagement”?
Generally, engagement means interaction with an app, but definitions can vary from research group to research group. However, in this context, some ways to measure engagement include:
Number opens or logins to the app
Time spent on an app
Number of mental health modules completed
Number of app features used
Duration of app use over days, weeks, months
Pham et al.’s (2019) scoping review of apps for chronic conditions organizes engagement indicators nicely: amount (e.g., number of logins), duration (i.e., time spent), breadth (e.g., number of features used), and depth (e.g., number of modules completed).
Clearly, engagement is a multi-faceted concept. The challenge of studying the relation between engagement and mental health arises when studies either do not define engagement, or only measure limited indicators of engagement.
This appears to be the problem with our two meta-analyses. Kulke and colleagues (2025) did not name a precise definition of engagement (perhaps because many studies in the analysis did not). Among the studies in their analysis, Valentine and colleagues (2025) noted 25 distinct engagement indicators, which they categorized into ten groups: “(1) rate of uptake, (2) time (min/h) spent on the app, (3) days of active use, (4) logins, (5) modules completed, (6) study metrics, (7) messages sent and received, (8) posts and comments made, (9) participant self-reports, and (10) miscellaneous” (p. 4). Seventeen studies included the most common indicators: the percentage of users who completed the anxiety/depression program or the percentage who completed per-protocol. The authors found no correlation between this type of engagement and symptom improvement.
Unfortunately, there weren’t enough studies using another engagement metric (e.g., number of logins) to conduct further analyses.
More promising findings
Linardon and colleagues’ (2026) study did reveal a positive relation between engagement and symptom improvement. First, they reviewed 28 randomized controlled trials (RCTs) of depression and anxiety apps reporting engagement metrics. The authors identified over 40 different engagement metrics among these studies, many of which overlapped with those identified by Valentine et al., including:
Number of in-app activities completed (e.g., thought records, relaxation exercises, messages to coach)
Duration of app use (e.g., daily average use, total time per use session)
Number of sessions or opens (e.g., number of downloads, number of logins)
Other: e.g., proportions of days with app use, number of modules completed, number of clicks, number of characters written by users (p. 8)
They also meta-analyzed 13 of these RCTs providing sufficient quantitative data. They found that across all engagement metrics, on average, greater engagement was associated with small, statistically significant improvement in symptoms. This overall effects remained significant when the authors checked for publication bias and conducted a sensitivity analysis.
When the authors dug into the specifics, they found that the number of completed tasks or activities, the number of app sessions, and time spent on the app were significantly associated with symptom improvement, but the number of days of app use was not. Results held for measures of depression, generalized anxiety, and social anxiety. However, it’s important to remember that these subsets of the body of literature meta-analyzed are small (2-9 studies).
The authors conclude that there could be a dose-response relationship between engagement and symptom improvement (i.e., more engagement, more improvement), suggesting the importance of increasing user engagement through app design. However, they caution readers that the number of studies was small, and that these engagement metrics do not fully or directly capture other important therapeutic factors that also affect outcomes, like motivation or active, thoughtful participation.
However, I think the difference in metrics between the Linardon meta-analysis and the Valentine meta-analysis is worth noting. Valentine et al. were only able to meta-analyze studies that measured the percentage of users who completed the anxiety/depression program or the percentage who completed per-protocol. “Completion” seems to be binary here: either you complete the program (or complete it per-protocol), or you don’t. When program completion is the metric, someone who does not fully complete the program, but who frequently engages with the app, spends a lot of time there, and engages deeply with app tasks and activities would be expected to improve less than someone who rushes through the entire program, engaging as minimally as possible.
I believe that the takeaway is to measure and analyze continuously when you can.* You preserve variance (differences among all participants in a research sample, even if those differences are small) when you measure continuously, and you lose it when you turn continuous data into dichotomous data (e.g., grouping people into “above the cutoff” vs. “below the cutoff”). Variance means statistical power, or the probability of detecting an effect if it is actually there. Reducing variance is like turning down the brightness of your flashlight - you might find what you’re looking for, but it’s a lot less likely.
What does this all mean for app development?
Engagement is a really tricky concept. There is no single, clean way to measure it. Even if we were to settle on one indicator - say, the number of app sessions a user engages in - time is always there to make things more complicated:
Is it just the total number of sessions a user engages in? Over what time period? Does the length of the session matter? Do users who engage very frequently over the first few weeks do better? Is there an optimal number of sessions per week? Is there an optimal time of day? Should users engage in many short sessions, or fewer long sessions?
It’s also important to consider whether the indicator itself is inherently important to mental health outcomes or whether it’s acting as a proxy for something else.** We might assume that someone who engages in more sessions is more motivated to learn to improve their mental health, or is finding more success with the therapeutic techniques - or perhaps they are more distractible and they leave and return to the app more frequently.
At the meta-analytic level, the research community is still figuring out standardization of engagement metrics. At the app level, however, all this complexity suggests the deep importance of collaboration among research, clinical, design, and engineering teammates long before launch. Which metrics do we need to collect in order to reveal the efficacy of the app? What does “efficacy” mean for this app? Which metrics are way too time-, space-, effort-intensive to capture on the engineering side? What needs to be user self-report vs. objective app data? Who knows the right statistical approach to take full advantage of the data at hand? All of these questions are important, and they’re much harder to properly answer after the app is in users’ hands.
*Yes, the percentage of users who completed the program is continuous, but completed vs. not completed still misses out on valuable variance.
**All the engagement indicators discussed so far are more behavioral - we haven’t even touched self-reported cognitive or emotional engagement yet!